How Gojek made forecasting a few clicks for every team
Most business forecasts live in a spreadsheet that cannot see Ramadan coming. In 2019 Gojek built a tool that let any team run a machine-learning forecast, holidays included, in a few clicks. Here is how it worked, and why the same idea is now a button in tools you already use.
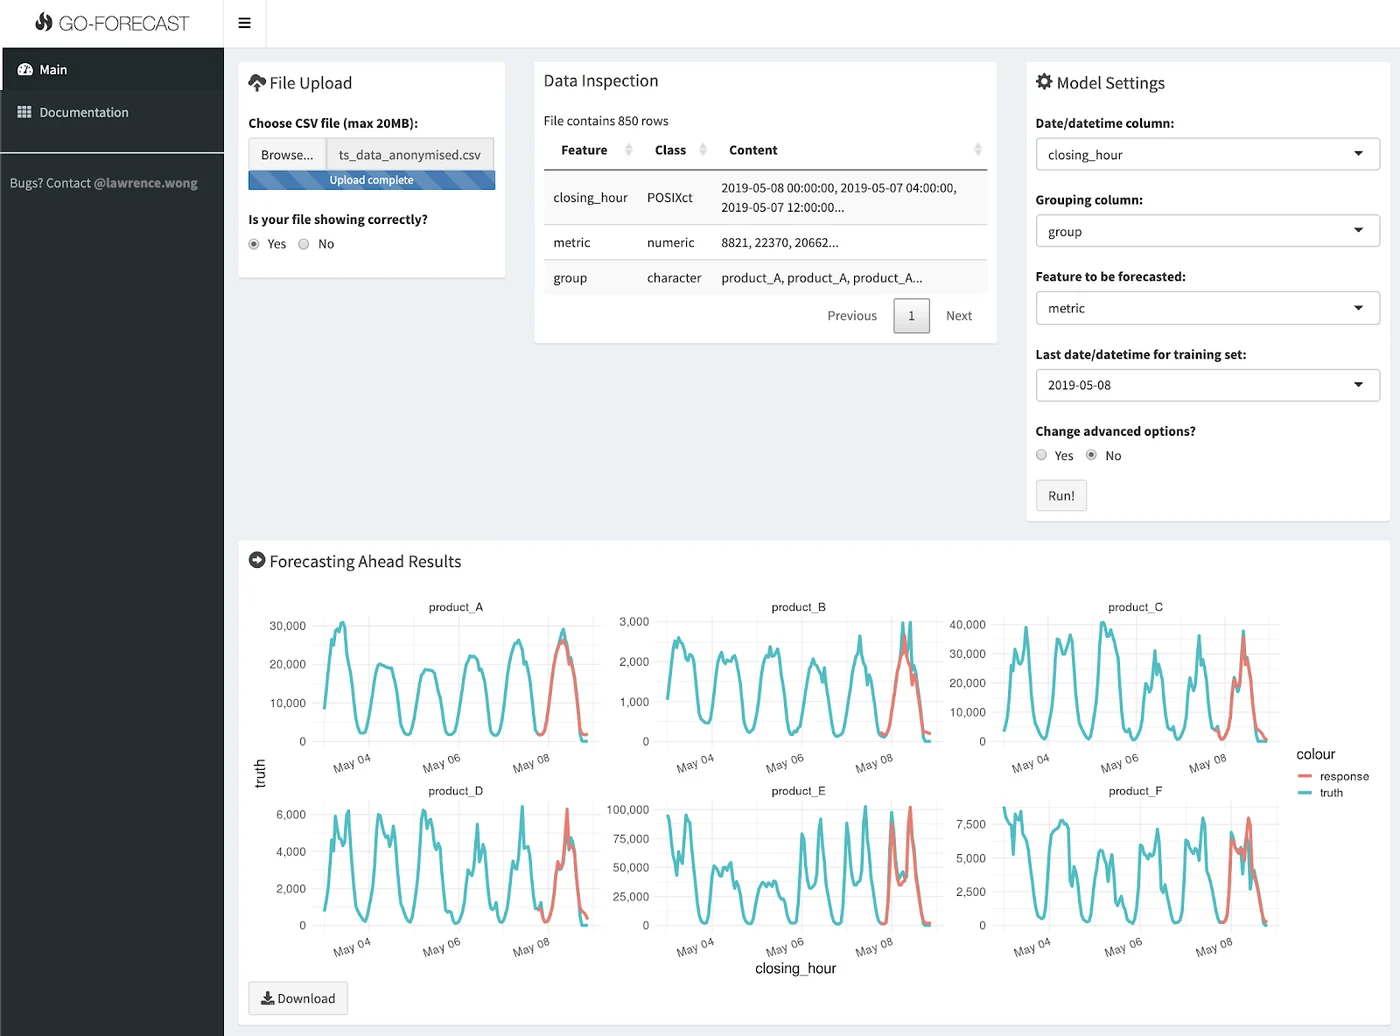
Forecasting is everywhere at Gojek. Almost every team depends on it, Gojek's engineers wrote, for critical decisions such as how to allocate resources. Yet in 2019 most of those forecasts were made the way most companies still make them: in Google Sheets or Excel, with methods that cannot take outside factors into account. In Indonesia the biggest outside factor is the calendar, and a spreadsheet trend line cannot see Ramadan coming. So Gojek built GO-FORECAST, an internal tool that let anyone run a machine-learning forecast in a few clicks, holidays included. It was born in June 2019 and written up that October. The post is short, but its central idea has aged well: the bottleneck in forecasting is rarely the data. It is the forecaster.
The problem: the data was there, the forecaster was not
Gojek's diagnosis was blunt. The quality of a forecast hinges on two things: having relevant data, and the forecaster's understanding of the problem. At a company of Gojek's size the data was usually there, new products being the exception. The forecaster was the weak link: "The latter is where we see huge room for improvement."
Most people forecast in a spreadsheet. Teams with an analyst got classic statistical models such as ARIMA or exponential smoothing (ETS), which Gojek concedes "do often work well". Their shared weakness is that they only look at the series itself. They cannot take in exogenous variables, the outside factors that move demand: a marketing push, a price change, a holiday. Gojek's own example is the one every Indonesian business knows, "the ever-shifting Ramadhan seasonality periods". The Islamic calendar is lunar, so Ramadan arrives about 11 days earlier every year, and a model that learns "what happened in this week last year" ends up looking in the wrong place.
The spark came from inside the company. One of Gojek's analysts won first place in a national data science competition in late 2018, and the team turned his winning approach into a tool anyone could use.
How they built it
GO-FORECAST is a small web app wrapped around a well-chosen recipe. The picture at the top of this article is its main screen: upload a CSV, check the data, pick the date column, a grouping column (cities, for example), the number to forecast and the last training date, then press Run.
Turn the time series into a table. The engine is XGBoost, a gradient-boosted decision tree model. Trees do not understand time on their own, so each date becomes a row of features: calendar signatures such as day of week, month and week of the year, lagged values of the target (what the number was a day or a week earlier), and an is_holiday flag. Once forecasting looks like an ordinary prediction problem, any extra column you can supply, such as a holiday or a spending plan, becomes something the model can learn from.
Many series, one click. Forecasting several cities takes a single Run.
Test the way time works. This is the detail that separates a useful forecasting tool from a misleading one. Ordinary cross-validation shuffles the data, so the model gets to train on days that come after the days it is tested on. In Gojek's words it "peeks into the future before making the prediction", which "will almost guarantee to overfit the model". GO-FORECAST uses time-series cross-validation instead: the validation period always sits at the end of each fold, and the training window grows fold by fold.
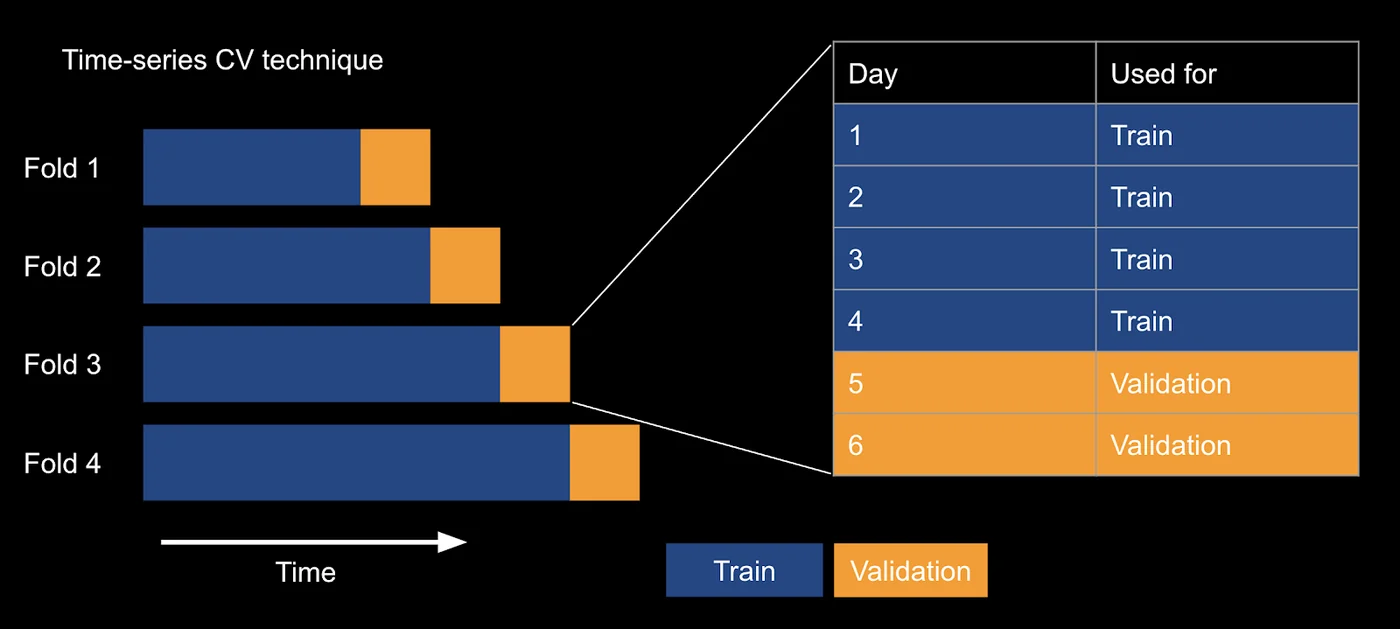
Show the uncertainty and the levers. The tool displays the cross-validation results so users can see how far off past forecasts were. It ranks features by importance, so a team can see which levers actually move the number, and it can play out scenarios, such as what happens to transactions if spending goes up or down.
The benchmark, and how to read it
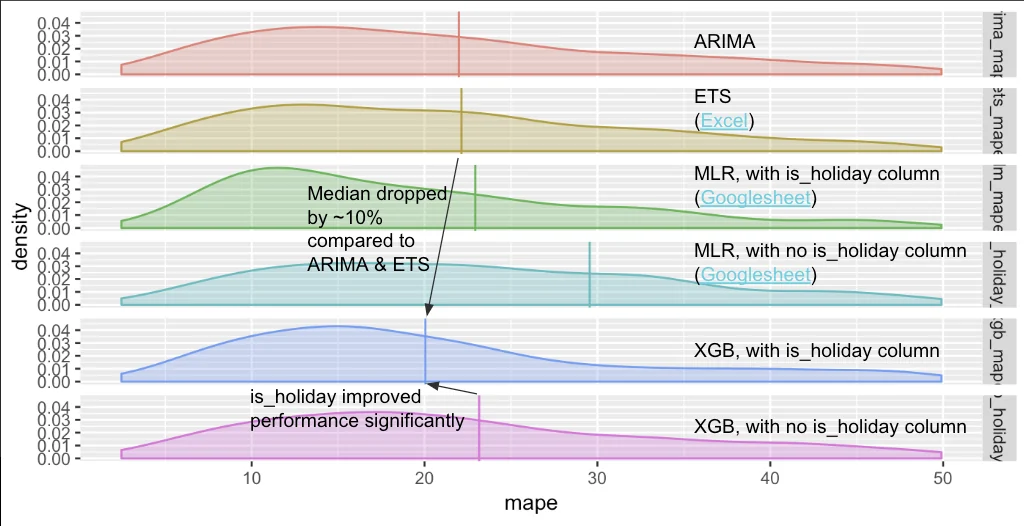
Gojek tested the approach on hundreds of real daily datasets from across the company, pitting six contenders against each other: ARIMA, ETS, linear regression with and without the holiday flag, and XGBoost with and without it. That came to thousands of models, scored by mean absolute percentage error (MAPE). Gojek reports that XGBoost with holiday information came out on top, with a median MAPE about 10 percent lower than ARIMA and ETS, the second and third best.
Three things to know before quoting that number:
- It is a relative 10 percent. On Gojek's chart, by our reading, the medians sit at roughly 22 percent error for ARIMA and 20 percent for XGBoost with holidays. That is about two percentage points. Useful, not magic.
- The test window was holiday-heavy on purpose. Gojek says it chose a forecast period with "more holidays than usual" to see whether the holiday flag helps. In Indonesia the calendar is the story, so it is a fair test, but expect a smaller gap in a quiet quarter.
- The features mattered as much as the algorithm. Gojek notes that a plain linear regression with the holiday flag was "only about as good as" XGBoost without it. Give a simple model the calendar and it closes much of the gap. The choice of algorithm comes second.
One more honest detail: Gojek cut its chart off at 50 percent because some models had a MAPE of "tens of thousands of percent". Percentage errors explode when actuals are near zero, so judge low-volume series with a weighted error such as WAPE.
What has changed since
The bet on boosted trees held up. In 2020 the M5 forecasting competition, built on Walmart's unit sales, was won by an ensemble of LightGBM models, a close cousin of XGBoost, and most of the leading entries used it too. Gojek's 2019 instinct became one of the field's lessons.
Forecasting without training. Since 2024, time-series foundation models have arrived: models pre-trained on huge collections of series that can forecast a new one without being trained on it. Google's TimesFM and Amazon's Chronos both launched that year. The newer versions also handle the outside factors that motivated GO-FORECAST. Amazon's Chronos-2 (October 2025) supports covariate-informed forecasting out of the box under the Apache 2.0 licence, and Google's TimesFM-3 (August 2026) takes known future events such as promotions and holidays. Read the licence before you build: the downloadable TimesFM 3.0 weights are for non-commercial, non-production use only, and Google points commercial users to its cloud services.
The tool became a button. The point-and-click forecast Gojek had to build in 2019 now ships inside common data tools. In BigQuery, a single AI.FORECAST query runs TimesFM over a table, and since February 2026 Google has been rolling out forecasting in Connected Sheets, so users can predict sales or demand "without needing to write SQL, use Python, or customize and train their own models". Snowflake and Databricks have built-in forecasting functions of their own.
Gojek moved on to language models. We found no follow-up on GO-FORECAST. GoTo's public AI work has since centred on LLMs, notably Sahabat-AI, an Indonesian-language model family launched with Indosat in November 2024.
Why it matters for your business
Indonesian demand runs on a calendar with moving parts, which is exactly what generic forecasting tools handle worst.
- Ramadan and Lebaran move. Idulfitri fell on 21 and 22 March in 2026 and comes about 11 days earlier in 2027. A "same week last year" forecast drifts further off every year.
- Money moves on its own calendar. THR, the religious holiday allowance, must be paid no later than seven days before the holiday. Retailers run payday sales around the 25th, and Harbolnas on 12.12 and the twin-date sales pull demand into single days.
- Even official forecasts miss. The transport ministry's survey expected 143.92 million people to travel during Lebaran 2026. Mobile positioning data later counted 147.55 million, 2.53 percent more.
The lesson from GO-FORECAST is not "use XGBoost". It is three habits: put the calendar into the model as data instead of a note in someone's head, test the way time actually flows, and judge forecasts by an error you can act on.
How we would build it today
For a hotel group, a restaurant chain or a retailer in Indonesia, we would start where no off-the-shelf model can: a calendar table for your business. Ramadan days, days before and after Lebaran, cuti bersama, school holidays, the payday window, 12.12 and the twin dates, and your own promotions. Then we would race three contenders in a rolling backtest that covers at least two Ramadans: a seasonal-naive baseline (the same day last week), a zero-shot foundation model (Chronos-2 runs on your own server, or BigQuery's built-in forecasting if your data already lives there), and a gradient-boosted model trained on your calendar table. Whichever wins on your data stays. Forecasts would land in the sheet or dashboard your team already uses, as a range rather than a single number, retrained weekly, with forecast versus actual logged so everyone can see the error. Gojek needed a custom app to get there in 2019. Today the clicks are free. The calendar and the honest test are still the work.