How Instacart predicts whether an item is still on the shelf
In 2023 Instacart rebuilt the model that guesses, for hundreds of millions of items, whether a shopper will find them. Three layers replaced a batch job that ran every two to four hours, and only about 1% of items get real-time scoring.
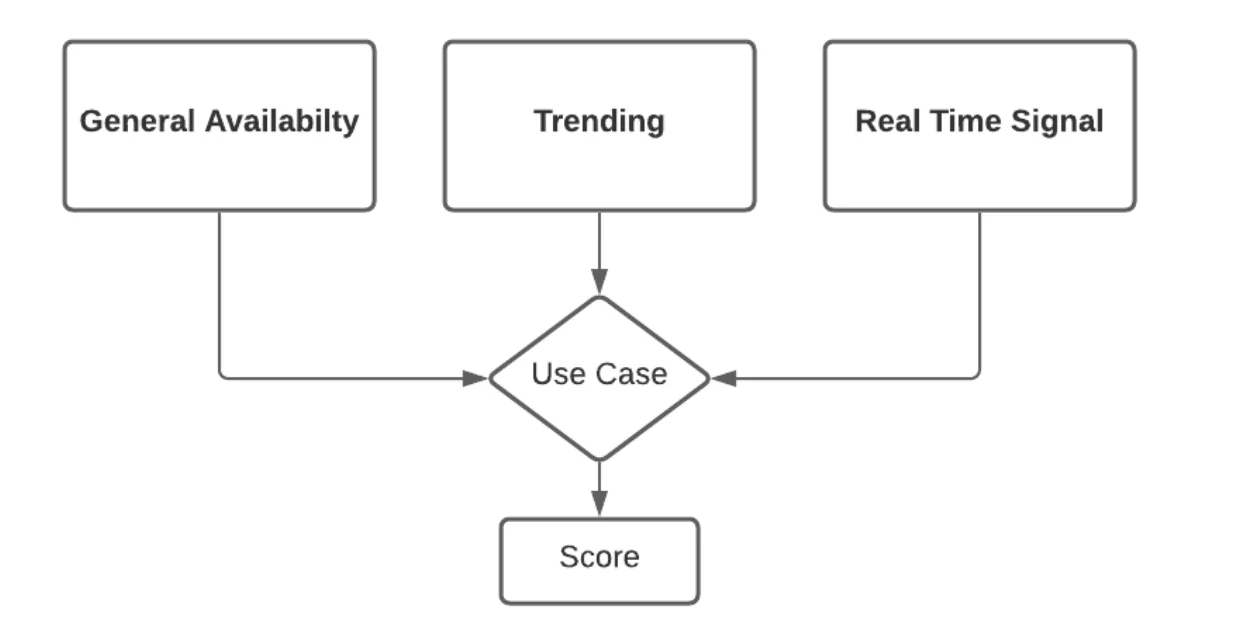
Instacart sells groceries from shelves it does not own. When a customer puts bananas in the cart, nobody at Instacart knows for sure that the store still has bananas. A shopper finds out later, in the aisle. So every product in every store carries a guess: "The model predicts the probability of finding an item in store, represented as a value between 0 and 1, for each item in our catalog." In July 2023 Jack He described how Instacart rebuilt that guess, in the middle post of a three-part series. The part worth copying is not a clever model. It is the decision to keep different answers for different moments, and to spend computing only where fresh signals exist.
The problem: the shelf changes faster than the data
The unit is small on purpose. "We treat the same product sold in different stores as different items, because the same product may have different inventory status in each individual store." The signals come from the shoppers themselves: every scan, and every item marked "not found", feeds the next prediction, together with whatever stock data a retailer sends.
The old system was a batch job: shopper events landed in the Snowflake warehouse, features were built there, and "a batch scoring job which ran every 2–4 hours" wrote the scores to a database. Three things went wrong with it. The scores were hours old. Most items had almost no signals, because the catalog is "hundreds times larger" than what shoppers touch. And one score was serving two different questions.
That last point is the one most teams miss. "For example, increasingly, customers like to plan ahead. A customer wants to place an order at night for early next day delivery, when some items may run out at the ordering time but will restock the next day at store opening time." Meanwhile, "routing of our shoppers to stores should always use the most recent signals, to identify the store with the most available items as of now." A customer ordering for tomorrow morning needs tomorrow morning's shelf. A shopper choosing a store needs this minute's shelf.
The business case comes from the first post: "Customers with orders that have a perfect found rate are twice as likely to retain and re-order compared to those with a low found rate." No sample or method is given, so read it as a correlation, not a proven cause.
How they built it: three layers, three time scales
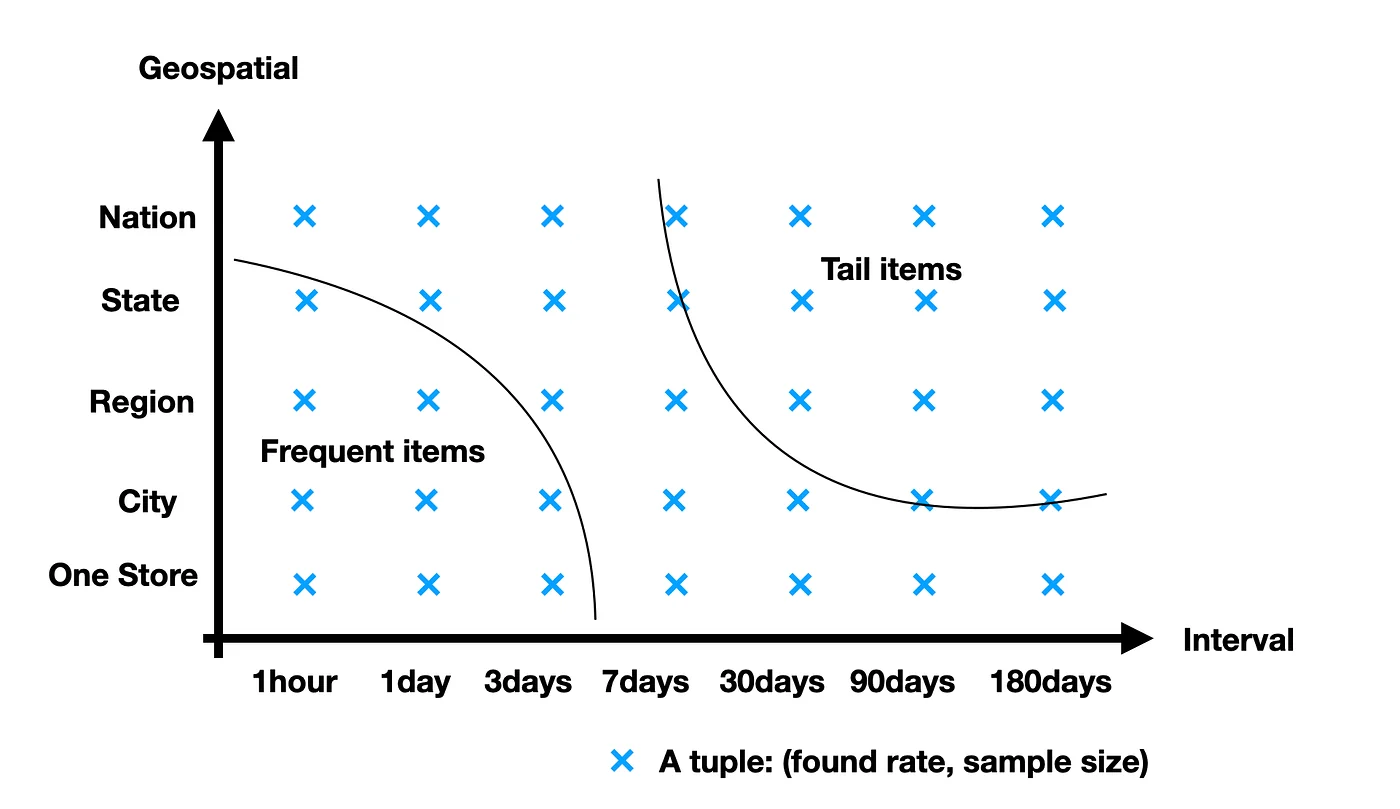
General: what is normal for this item. The first layer is not machine learning at all. It is a found rate, computed on the smallest local and recent sample that is big enough to trust. "By imposing a required sample size K, determined by offline empirical evaluations, we are able to identify the minimally sufficient scope and confidently answer the “typical” availability question." A popular item such as organic bananas has enough events in one store over seven days. A rarely bought item may need the whole country over 180 days. K is never published.
Trending: what changed recently. An XGBoost model predicts how far the last 0.5 to 30 days push an item away from its normal level. The General score goes in as a feature, and it carries the most weight, so a team can see how much a recent event moved the prediction.
Real time: what the last shopper saw. For the most active items, a third layer reads the time since the last observation, the last status a shopper or retailer reported, and stock levels. It also learns how quickly shelves are refilled, because "the predictive power of a single signal wanes over time." A "not found" from ten minutes ago means more than one from yesterday.
Spend where the signals are. Not every item gets every layer: "head (frequent) items have the latest signals within 10 hours (about 1% of all unique items scored), torso items within a month (about 85%), and the remaining items are considered tail." Only head items get hourly trending scores and real-time inference. Instacart reports that this tiering cut computing cost "by about 80%", without saying 80% of what.
One API, different answers. A request names its use case and gets the matching score: "In this way, we can use a real time model for shopper routing, while serving our customers with a model predicting availability in a future fulfillment time."
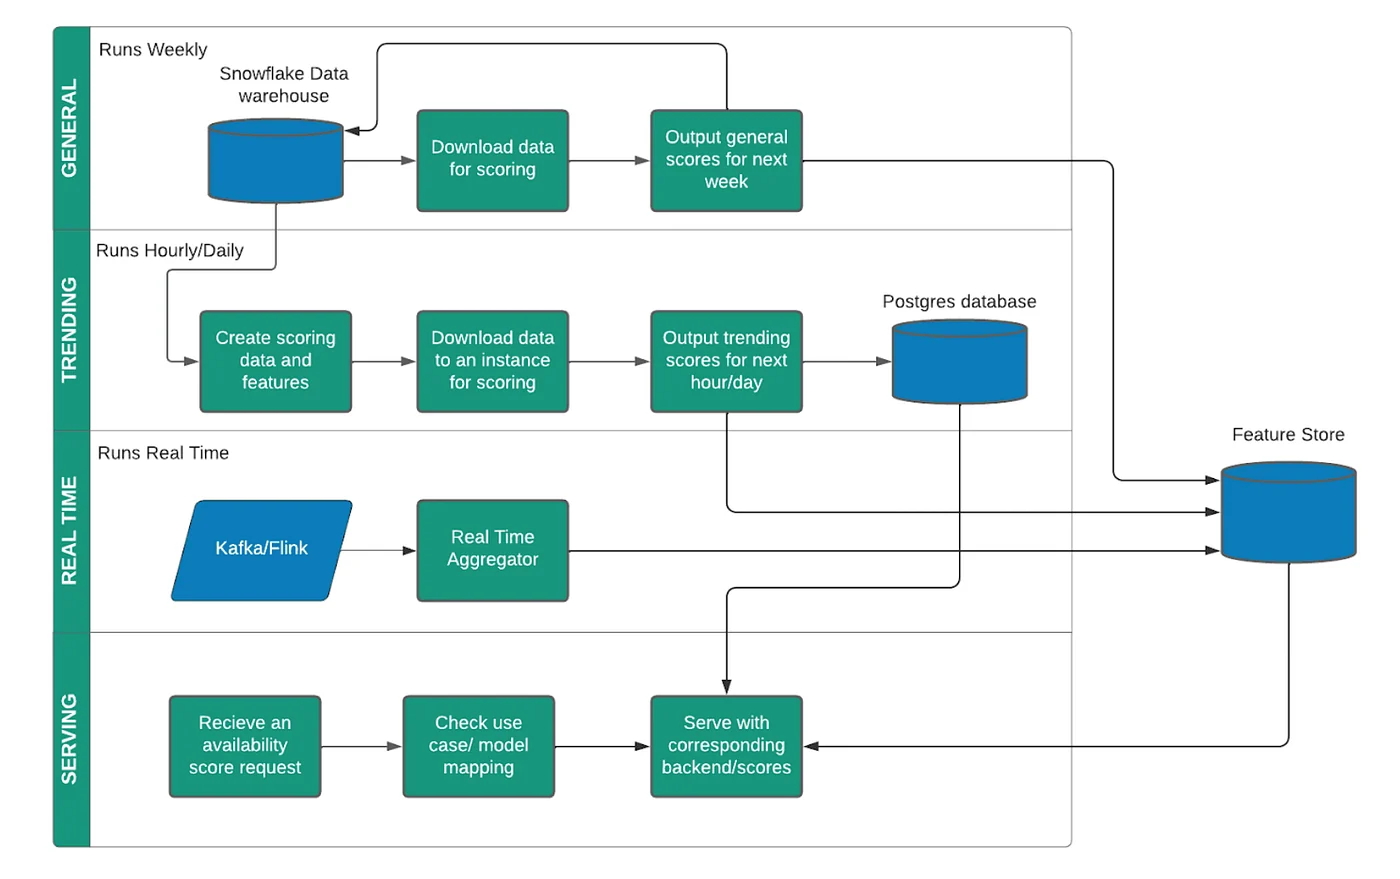
The third post adds the plumbing. Scores sit in a database, and an item's score is refreshed when it shows up in search results, which "allowed us to update scores more frequently while reducing the ingestion load by 2/3rds." Each model gets its own column, so A/B tests need no new code. And cut-off thresholds can be adjusted per category: when baby formula ran short, the team changed one category's thresholds instead of retraining.
What it delivered
Less than the title suggests. The post says the new model "has shown significant improvement in terms of business metrics and engineering performance", offline and in an online experiment, but gives no numbers: no accuracy, no change in found rate, no test size. The third post reports a "6X increase in experiments run using the new framework" and the two-thirds cut in ingestion load. Those describe engineering speed, not shelf accuracy.
What has changed since
The most useful follow-up is about what to tell customers. In February 2026 an Instacart data scientist and a Boston College researcher published a study in Management Science on a field experiment with more than 840,000 Instacart customers. When the app said an item was likely out of stock, customers were 25% less likely to buy that item. But over the long term their spending rose 5.8% and their order frequency 5.7%, refunds fell 3.7% and replacements 2.9%. It is peer reviewed, though the experiment and one author are Instacart's.
Instacart has also moved from predicting the shelf to looking at it. In March 2025 it announced Store View, where shoppers film shelves aisle by aisle and computer vision flags what is in stock, out or running low, and Second Store Check, which sends a second shopper to a nearby store when an item is missing. It cited an industry study that "as much as 60% of inventory records are inaccurate." In September 2026 it began offering that shelf data to grocers and to brands as software. No new model metrics have been published since 2023.
Why it matters for your business
Indonesian online grocery has largely gone the other way. Quick-commerce players such as Astro run their own dark stores: in 2022 Astro had 20 of them in Jakarta and South Tangerang, and in 2025 it listed about 1,500 products. When you own the stock, availability is a replenishment and forecasting problem, and you know what is on your shelf.
The moment you pick from someone else's shelves, a supermarket partner or a market supplier, or promise next-morning delivery from stock that has not arrived yet, you have Instacart's problem in miniature. Two habits apply at any size. Keep separate answers for "now" and "at delivery time": a fresh-produce order placed at night is judged against tomorrow morning's stock. And tell customers when an item is uncertain. A "stok menipis" label costs a few sales of that item, and the Instacart study suggests it pays that back in fewer refunds and more orders.
How we would build it today
- Log the picker's verdict. Found, not found or substituted, with a reason and a time, per item, store and delivery slot. This one table is both the training data and the real-time signal.
- Start with a found rate, no model. Store, then nearby stores, then city, over 7 to 180 days; stop at the first level with enough events.
- Two scores behind one API. "Now" for routing and instant orders, "at slot" for next-morning orders.
- Add a trending model later. LightGBM or XGBoost on the gap from the found rate, with local calendar features: paydays, Ramadan and Lebaran, long weekends, supplier delivery days, promotions.
- Real time only for fast movers. The top 1 to 5% of items.
- Thresholds ops can change during a shortage, with an audit log.
- Test the label first. A/B test the "stok menipis" tag and a substitution preference at checkout; measure perfect orders, refunds and repeat purchases.
Postgres or BigQuery, a Redis cache and a managed queue are enough for a mid-size operator. Kafka and Flink can wait.