How Walmart told a defrost from a broken fridge
In November 2021 a Walmart data scientist described a small trick for store refrigeration. Treat a case's temperature as a steady level, a repeating defrost wave and noise, find the wave with a Fourier transform, and you know when a warm-up is normal. It fills in missing defrost data and points at broken sensors. The results are modest, and the idea is cheap enough for any chain.
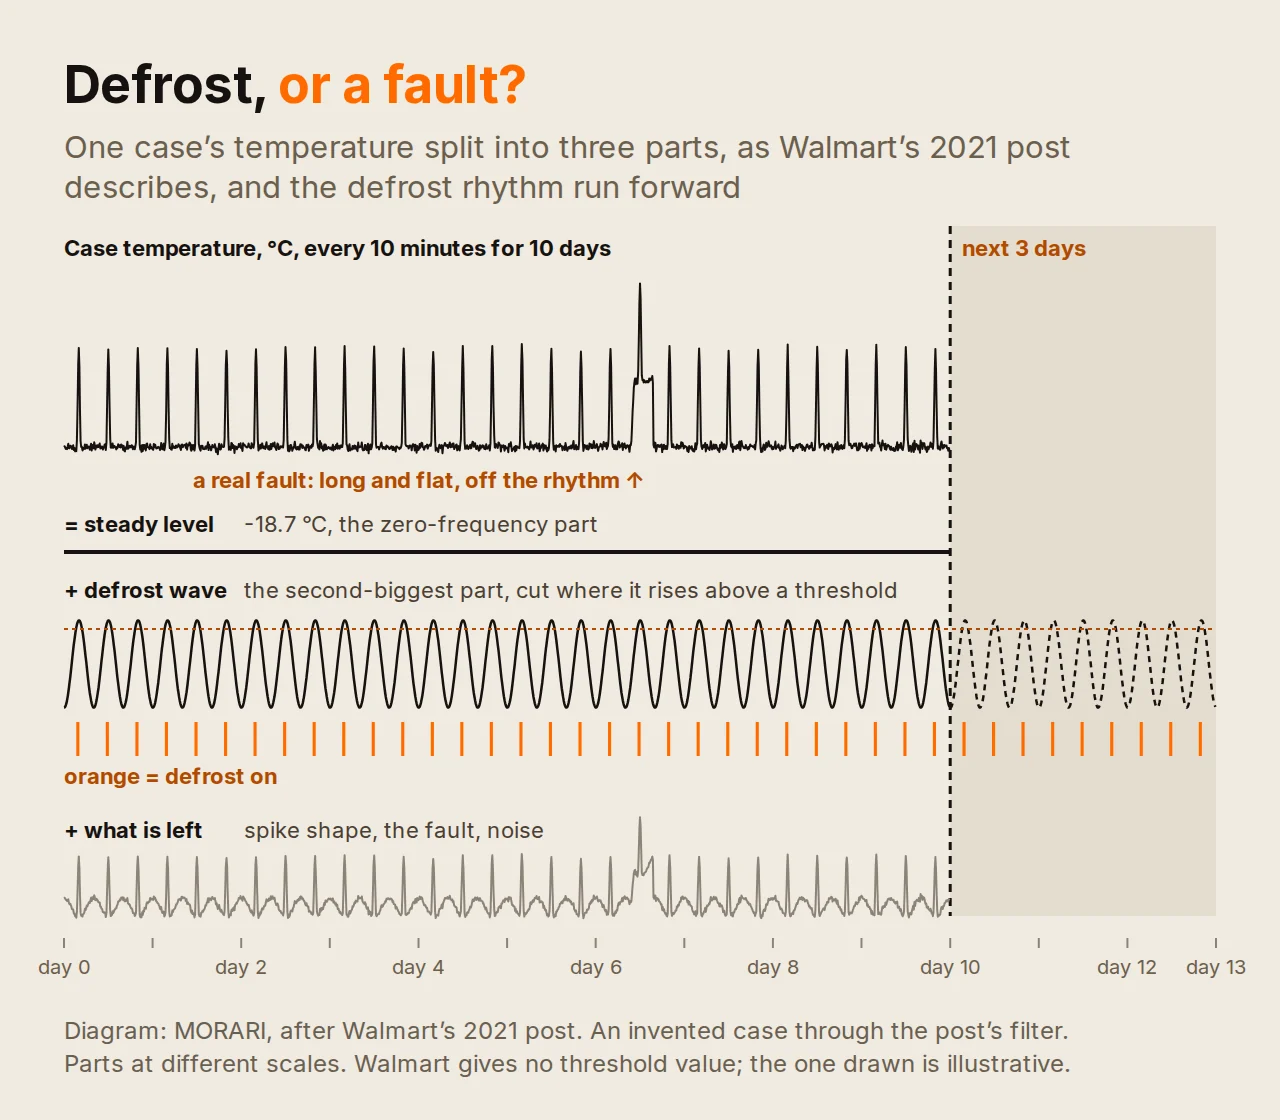
A freezer full of ice cream warms up by several degrees. Is it failing, or is it defrosting? Every refrigerated case melts its own ice on a schedule, and during that time it runs warm on purpose. A monitoring system that cannot tell the two apart either cries wolf several times a day or learns to ignore warm-ups, including the real ones. On 25 November 2021 Sujay Madbhavi of Walmart Global Tech described how Walmart answers that question with a tool from the 1800s: the Fourier transform.
The problem: a warm fridge is not always a fault
Walmart's January 2021 page says it "manages more than 7 million unique IoT data points across our U.S. stores", which send "almost 1.5 billion messages" a day. A signal that needs a person can end in "submitting a work order and getting a technician on-site".
A sister post from August 2021 describes the anomaly forecaster this work feeds: "around half a million refrigeration systems" across "~3600 stores", with sensor data "at a 10minutes interval along with metrics like if the system is in defrost or not". Its rule is simple: "Forecasts are tagged as anomalies based on these differences when defrost is off".
That rule only works if you know when defrost is on. The defrost post explains why: "During defrost, the refrigeration unit warms up and its temperature increases significantly above steady state. As a result, it becomes important to correctly identify if a rise in case temperature is due to an anomalous event or defrost." The defrost flag in the data is not always there, and not always right. And the timing drifts: "these defrost periods shift gradually over course of time depending on factors such as external weather, case contents, store traffic, repairs, etc."
How they built it
Use temperature alone, in three parts. The post relies on "univariate case temperature data of a refrigeration case": one case, one line of readings. The team treats the temperature "as being composed of three parts : defrost, steady state temperature and error." The steady level is the setpoint the case holds. The defrost is a warm-up that repeats. The error is everything else.
Let the Fourier transform find the rhythm. A Fourier transform rewrites a signal as a sum of waves of different speeds and sizes. For a case that defrosts on a schedule, two waves dominate. In the post's words, "steady state temperature had zero frequency (dc signal) and highest magnitude, and defrost signal belonged to frequency with second highest magnitude."
Keep that wave, drop the rest. The code is a few lines of NumPy: transform, keep the components at or above the second-largest magnitude, transform back. What remains is the steady level plus one smooth wave at the defrost rhythm.
Cut the wave into on and off. The wave becomes a defrost flag "by thresholding the sinusoidal defrost signal at a suitable point". A figure in the post adds the rule: a point is defrost only if the wave is rising and above the threshold. The threshold value is not given.
Run the wave forward. Because the wave repeats, the last step is to "Predict defrost periods in upcoming days by extrapolating the identified defrost signal."
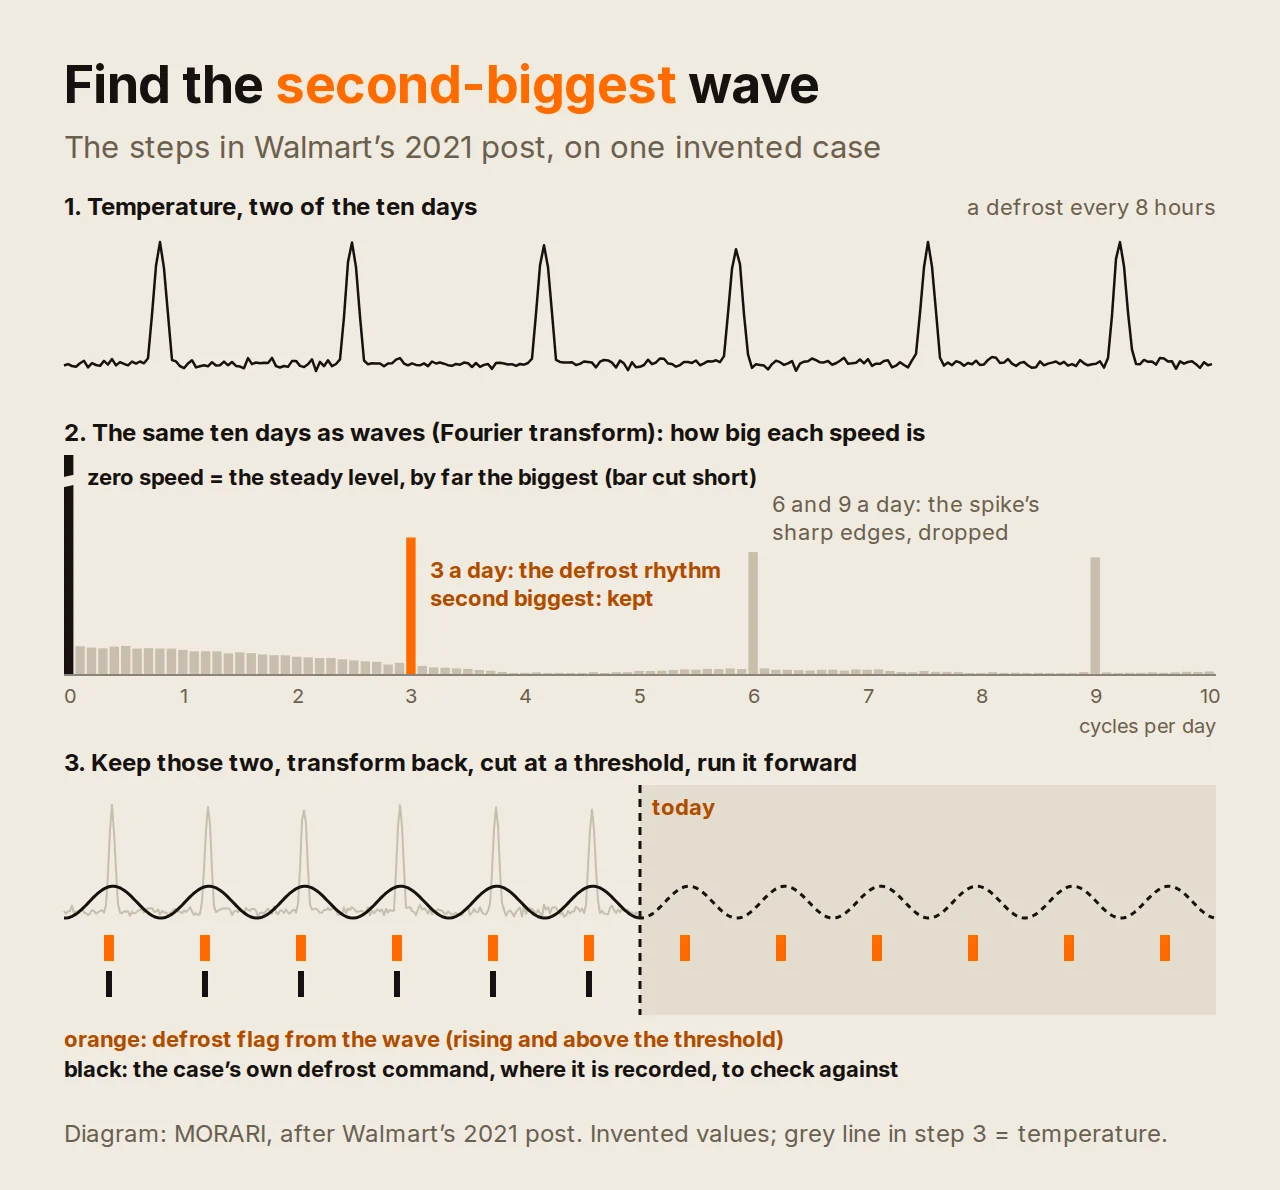
Check against the cases that know. In the post's words, "we have a few refrigeration cases where the defrost command is accurate and readily available in IoT sensor data. We benchmarked our results against these cases." A results slide in the post gives the setup: ten days of training data, three days of testing, 30 daily runs over one month, across refrigeration cases in all Walmart US stores.
What it delivered
The text reports one number: where defrosts are regular, "precision and recall are >80% on an average." The results slide, which covers all cases, shows accuracy above 80%, precision above 75% and recall above 70%. The post does not say how many cases were regular, so the two sets of numbers cannot be joined. Both are Walmart-reported, with no baseline such as a fixed schedule to compare against.
The weak spot is named plainly: "The performance is low for cases where defrosts are aperiodic or lack general pattern."
The most useful finding is a failure. In one example the predicted defrost looks right but the recorded command peaks after the warm-up, so precision and recall come out at zero. "Thus cases, where the model is performing really bad, can be considered as potential data quality issues and flagged for further inspection." A bad score becomes a finding about the sensor, not the model.
The post lists three uses: generate the defrost command where the data lacks it, predict the schedule, and "Identify and correct historical defrost command for cases where defrost command in IoT data is inaccurate". The next step, it says, is a version "based on refrigeration case type, contents and inputs from domain experts."
Two limits are ours to point out. One smooth wave cannot draw a short, sharp warm-up, so the threshold does the work of setting how long each defrost lasts. And a Fourier transform over a fixed window sees one average rhythm, so a schedule that changes mid-window gets blurred. The daily runs on a short window are what keep up with the drift.
What has changed since
We found no later Walmart post on this model. Its recent posts are about streaming, databases and security, and a search of its public GitHub organisations finds nothing on refrigeration.
The managed route got thinner. AWS's Lookout for Equipment, a service for "automatically detecting abnormal equipment behavior", carries this notice: "On October 7, 2026, AWS will discontinue support for Amazon Lookout for Equipment." AWS has since added anomaly detection to IoT SiteWise, generally available since July 2025, which allows "accommodation for planned downtime". That post is about factory equipment, not supermarket cases.
Refrigeration makers sell monitoring themselves. Copeland's service promises analytics that "detect patterns and identify risk signals to predict issues before they lead to downtime, product loss or emergency service calls", with "exception-based workflows". These are vendor claims with no numbers.
The cases themselves are changing. In the US, EPA rules under the AIM Act limit the refrigerants new store systems may use. After a May 2026 revision, EPA's sector table sets an interim limit of 1,400 for new supermarket systems from 1 January 2027, falling to 150 or 300 from 1 January 2032. A model trained on old cases needs checking on new ones.
Why it matters for your business
Indonesia has one of the densest small-store networks anywhere. Indomaret alone added 944 stores in 2025, "bringing the total to more than 24,000 stores" in 35 provinces, according to its parent's annual report. Alfamidi reported 2,587 outlets at the end of 2025. Each store has chillers and freezers, and no team can watch them all by hand.
The rules ask for watching. BPOM regulation 21/2021 on food in distribution says refrigerated storage and display "seharusnya memiliki indikator/pengukur suhu, dimonitor, rekaman tersedia": a temperature gauge, monitoring and records. For frozen food BPOM's explainer says it stays frozen "pada suhu -18°C sepanjang rantai distribusi dan penyimpanannya". A log full of defrost warm-ups that nobody can explain is a weak record.
Fleets will change here too: Indonesia ratified the Kigali Amendment, which phases down HFC refrigerants, by Perpres 129/2022. Under the amendment's first schedule for developing countries, consumption is capped at the baseline from 2024 and cut in steps from 2029. Old and new cases will run side by side for years.
The lesson is not the Fourier transform. It is the order of work: know what normal looks like for each case before you call anything a fault.
How we would build it today
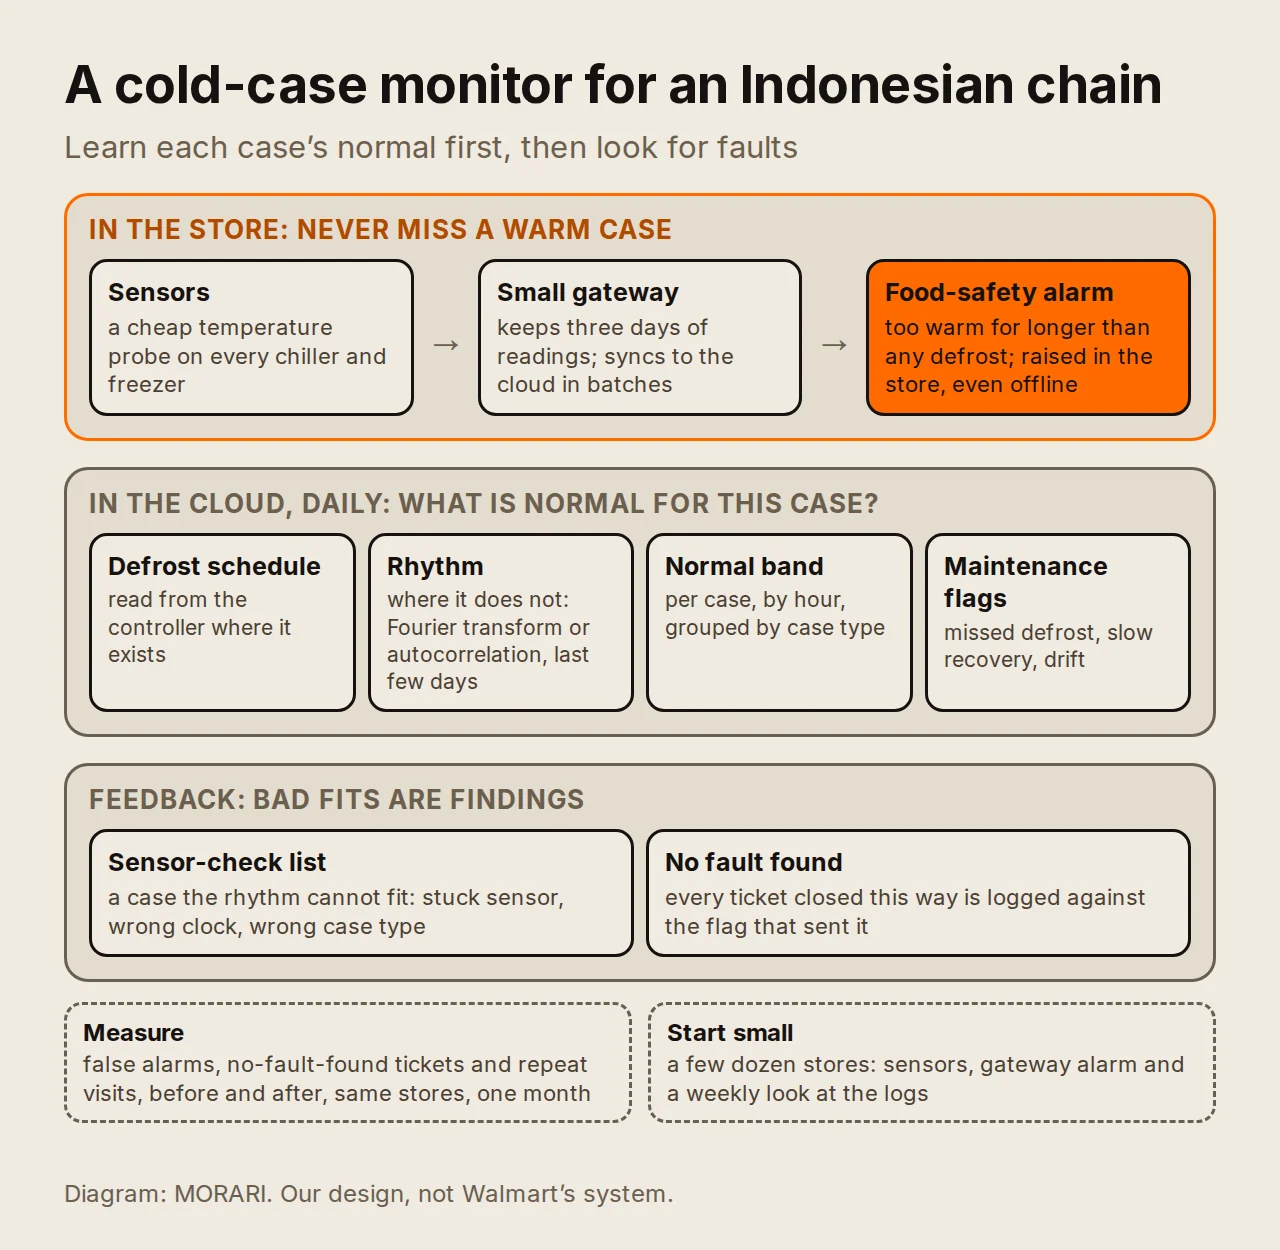
- Ask the controller first. Many case controllers already log the defrost state or schedule. Read it, and infer the rhythm only where it is missing or wrong, as Walmart does.
- Keep two kinds of alarm. A food-safety alarm on time spent above a limit, longer than any defrost, that is never masked. And maintenance flags, such as a missed defrost or slow recovery, where defrost windows are masked.
- Alarm at the edge. A small gateway in the store holds three days of readings and raises the food-safety alarm itself, so a dropped connection does not drop the alarm. Sync to the cloud in batches.
- Learn each case's normal. Find the defrost rhythm per case with a Fourier transform or autocorrelation over the last few days, and build an hourly normal band. Re-run daily, and fall back to a plain band when a case has no clear rhythm.
- Treat a bad fit as a finding. A case the rhythm cannot fit goes to a check list: stuck sensor, wrong clock, wrong case type in the master data. Walmart's zero-score example is the model for this.
- Group by type. Freezer, chiller, open deck, brand and refrigerant behave differently. Keep the type on every case, so a new system is not judged against an old one.
- Measure the alarms. Count false alarms, tickets closed as no fault found and repeat visits, before and after, on the same stores for a month.
For a chain with a few dozen stores, steps 1 to 3 and a weekly look at the logs are a fair start. Add the per-case rhythm when the false alarms cost more than a technician's afternoon.