How Zillow rebuilt its home-value model into one neural network
Most people know the Zestimate as the number next to a house on Zillow. Behind it is a valuation engine Zillow rebuilt from scratch, and the redesign is a clean lesson for anyone pricing assets at scale.
The Zestimate is Zillow's estimate of what a home is worth. Zillow computes one for more than 100 million homes in the United States that are not even for sale, and refreshes them several times a week. In 2021 the company rebuilt how that number is produced, and in early 2023 its engineers explained the redesign in Building the Neural Zestimate. The lesson travels well beyond housing: anyone valuing many things at once (homes, cars, inventory, land) eventually faces the same problem Zillow did.
The problem: a pipeline of many models
Before the rebuild, the Zestimate came out of a chain of separate models, most of them region-specific. Roughly: measure how prices in a region moved over time, adjust past sale prices for that appreciation, train ensemble models to estimate value from a home's features, then combine the outputs. Each stage was trained on its own.
That design worked, but it was heavy. Many models to maintain, region by region. Hard to improve one part without disturbing another. And because the stages trained separately, you could never optimize the whole thing end to end.
The rebuild: one national neural network
In June 2021 Zillow replaced that pipeline with a single national-scale neural network. One model, trained on every region at once, learning the previously separate steps jointly. Two ideas make a single model work across an entire country:
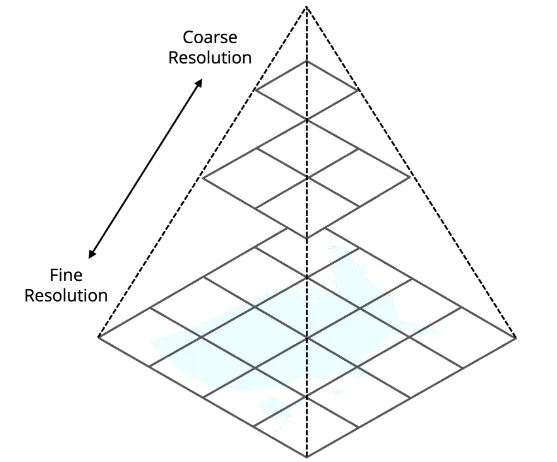
- Geography as embeddings. Zillow splits the map into geographic tiles at multiple scales of resolution, coarse and fine (an approach in the same family as Google's S2 and Uber's H3 grids). Each tile is a category, and the network learns a vector for it. Location has enormous variety, which is a weakness for classic machine learning but a strength for deep learning, which is built to turn high-variety categories into learned representations.
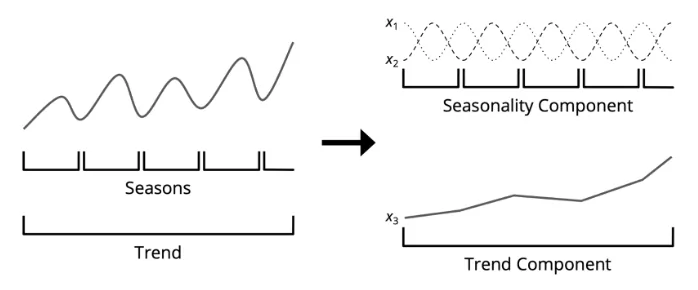
- Time as trend plus season. Instead of feeding in raw dates, the model decomposes time into a long-term trend and repeating seasonal patterns. That avoids the abrupt year-over-year jumps a naive model would produce.
It also does not just return a single number. Using quantile regression, it produces a range around the estimate, reflecting how liquid a market is and how much buyers and sellers disagree.
Did it work?
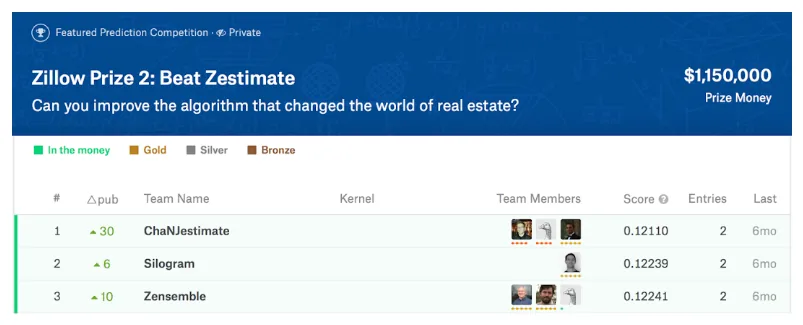
The whole approach was inspired by the Zillow Prize, a competition with 1.15 million dollars in prize money to beat the Zestimate. The winning solution improved on Zillow's benchmark by about 13 percent, and that result pushed the redesign.
The rebuilt model cut relative error by more than 15 percent nationally versus the old system. At launch in June 2021, the national median error was 6.9 percent across 104 million off-market homes. By the 2023 write-up it was 7.49 percent. And because there were far fewer models to train and run, the estimates were computed faster and at a fraction of the previous cost.
What has changed since
- In 2026, in a retrospective on twenty years of the Zestimate, Zillow reports a median error around 7 percent for off-market homes across roughly 125 million homes, and about 1.8 to 1.9 percent for homes actually on the market (where a live listing price is a strong signal). It names its next directions as multimodal inputs (photos, floor plans, text) and better explanation of what drives an estimate. Both are framed as direction, not shipped features with a reported accuracy gain.
- In April 2026 Zillow described a separate transformer model that reads a user's behavior for search and recommendations. It states plainly that this model is not used for valuation, lending, or other regulated housing decisions.
- On the regulation side, US financial regulators finalized quality-control rules for automated valuation models in August 2024, effective October 2025, covering lenders that use such models in mortgage decisions: fairness, testing, anti-manipulation. The Zestimate is not used for underwriting, but it marks where the scrutiny sits.
Why it matters for your business
Valuing a large catalog of things, one segment at a time, is common and painful: a model for this city, another for that brand, another for that category. Zillow's redesign points at a better shape:
- One model can beat many. When you can encode the segment (a location, a car brand, a product category) as a feature the model learns, a single well-built model often beats a stack of per-segment ones, and is far easier to maintain.
- Encode where and when properly. Location works best as learned embeddings, not a long list of yes/no columns. Time works best split into trend and season.
- Return a range, not just a number. A value with a confidence band is more honest, and more useful to a salesperson deciding how hard to push.
- Data quality matters more at scale, not less. A bigger model on messy data just makes confident mistakes faster.
- If a valuation ever touches a regulated decision (a loan, an insurance quote), fairness, testing, and explainability stop being optional.
How we would build it today
For a property or vehicle valuation tool in Indonesia, we would start simple and explainable: a gradient-boosted model on solid features (location, size, specs, condition, and recent comparable sales pulled from your own CRM). Once there is enough volume, encode location as area embeddings (province, kota, kelurahan) rather than hundreds of columns, and split time into a trend plus the seasonal swings that actually move your market, such as Lebaran and year-end. Output a price range, not a lone figure. Use a language model to turn messy listing text and photos into clean features, not as the valuer itself. And keep an honest backtest: train up to a date, then test against the sales that closed after it.